- تعلیم
- Estratégias de Negociação
- Estratégia de Trading Breakout Simplificada
Estratégia de Trading Breakout Simplificada
Você já quis prever grandes movimentos de mercado antes que eles acontecessem? Aprenda uma estratégia de trading simples que combina indicadores tradicionais para isso. Este guia vai simplificar seu trading e aumentar seu potencial de lucro.
- Fundamentos da estratégia Breakout: Aprenda o conceito principal.
- Configuração de indicadores: configure MACD, RSI e identifique níveis importantes.
- Identificação de oportunidades: encontre sinais de entrada usando os indicadores.
- Execução do trade: decida quando e onde entrar no trade.
Fundamentos do Breakout
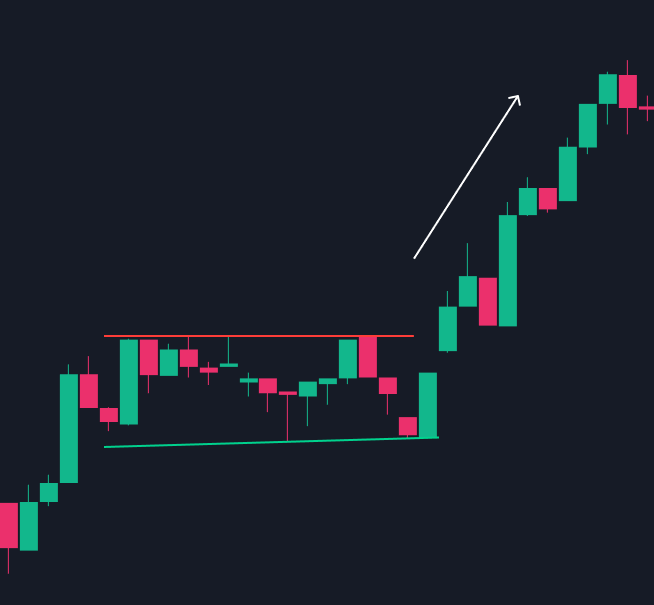
O trading breakout é uma estratégia dinâmica que foca em identificar movimentos significativos de preço quando um ativo rompe níveis de resistência ou suporte chave. É como pegar a onda no momento em que ela se forma — se o timing estiver certo, você pode lucrar.

Configuração de Indicadores
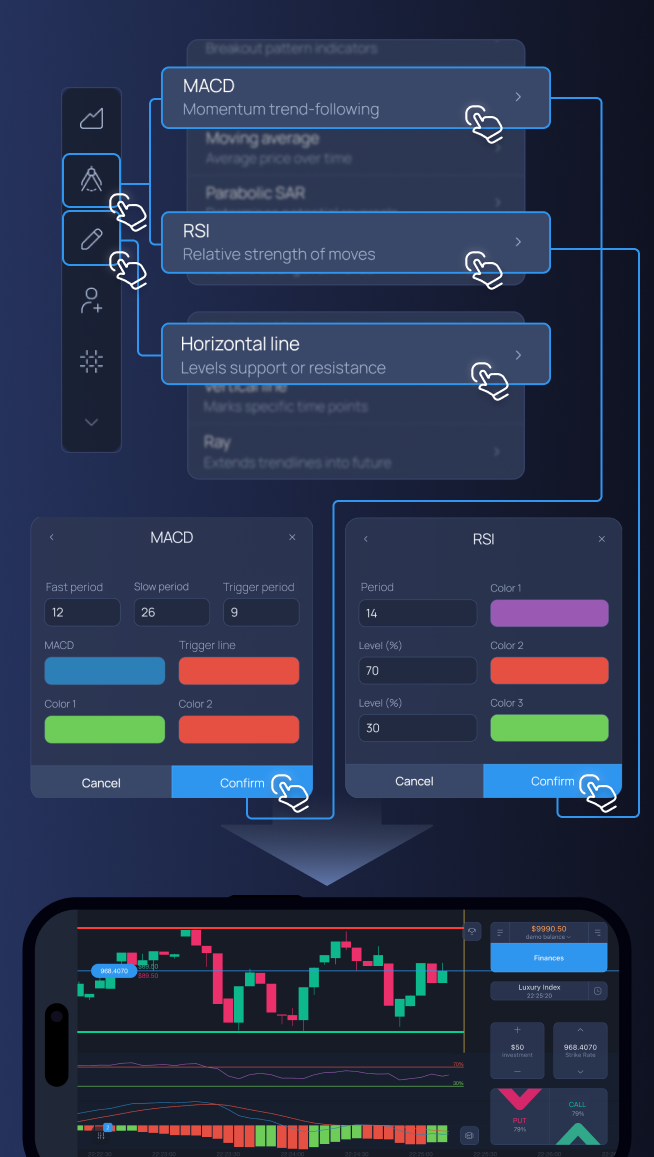
- MACD (Moving Average Convergence Divergence): use as configurações padrão (12, 26, 9). Ajuda a identificar momentum e direção da tendência.
- RSI (Relative Strength Index): use o período 14 para medir condições de sobrecompra ou sobrevenda do mercado.
- Suporte e Resistência: identifique níveis históricos onde o preço frequentemente reverte ou rompe.

Identificação de Sinais
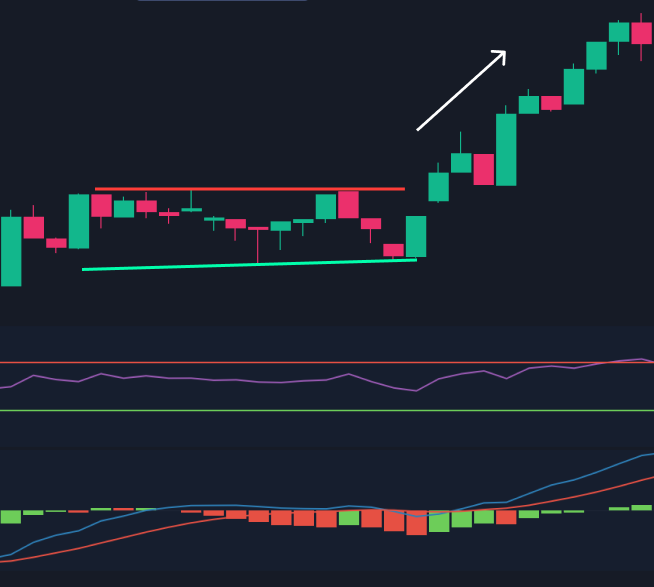
- MACD: cruzamento da linha MACD acima da linha de sinal indica oportunidade de alta (bullish), abaixo indica baixa (bearish).
- RSI: acima de 70 indica sobrecompra (possível oportunidade de venda), abaixo de 30 indica sobrevenda (possível oportunidade de compra).
- Suporte e Resistência: breakout ocorre quando o preço rompe esses níveis com volume significativo.

Execução do Trade
- Breakout de Alta: execute trade de compra quando o preço romper a resistência, MACD cruzar acima da linha de sinal e RSI não estiver sobrecomprado.
- Breakout de Baixa: execute trade de venda quando o preço romper o suporte, MACD cruzar abaixo da linha de sinal e RSI não estiver sobrevendido.
Domine esta estratégia combinando MACD, RSI e níveis de suporte/resistência para melhorar suas decisões de trading. Pratique em nossa plataforma e aumente sua confiança como trader. Comece hoje a jornada para se tornar mais informado e bem-sucedido!